EMCA

The EMCAwiki reached a milestone in 2019

I recently wrote this congratulatory email to the wonderful admins of the Ethnomethodology and Conversation Analysis Wiki (http://emcawiki.net) to congratulate them on reaching a real milestone in this community project. We don’t really have a place to share these things yet so I’m putting it here.

If you are reading this and would like to get involved in the wiki or related projects mentioned here, please drop me an email or message me on Twitter.

Dear Paul and the EMCA wiki team,

I can’t quite believe it’s been six years since we started the EMCAwiki project – when Paul sent out an email via the languse mailing list asking for help with his original EM/CA news site and we began the discussions that led to the lovely bibliography wiki we now run.

Towards the end of 2019 we finally completed the transfer of all remaining legacy bibliography entries to the new wiki format from Paul’s original very long PDF files. We now host a grand total of 8537 entries – from our first entry: (Harold Garfinkel, (1949), “Research Note on Inter- and Intraracial Homicides”, Social Forces, vol. 27, no. 4, pp. 369–381.) – to a host of new papers published as recently as this first week of 2020. We can now begin consolidating and standardizing our work (as Andrei Korbut has been doing brilliantly over the last few months) – making sure things are consistent, and then thinking about how to explore, analyze and share the EM/CA bibliometric data we now have at our disposal. I’ll write more about that below – but this is quite an achievement, and I’m very grateful to all of you, for putting in such incredibly generous and dedicated work.

Before I say anything more or propose any new projects or initiatives, I should say that one of the things I like most about the EM/CA wiki is the almost total lack of administrative overheads. So many things in academic life are bogged down with committees, meetings, action items etc… I love the fact that from the beginning we’ve not really done that, but have mostly just got on with the tasks we thought necessary to the best of our individual and collective abilities. We’ve sometimes made efforts to met up at conferences, which has been fun, and have continued to take the pragmatic approach of just doing what we can when possible without undue pressure or overarching expectations. This is outstanding, and long may it continue.

Having said that, I did take on a new role in 2019 – that of ISCA communications & information officer, and I now participate in more admin meetings than I would usually aim for. These are great fun, and some have included ideas that involve EMCA wiki. I wanted to share some of those ideas with you now, and leave it open to you all to respond (or not) in what is now a time-honored laid-back tradition of the EMCAwiki admins.

Firstly, I am aware that the reason I was elected to the ISCA board was because of this project and all of your work. I would like to acknowledge that publicly by adding a page to the new ISCA website I’m currently developing – aiming to launch it towards the end of January 2020. I have kept a list of admins here: http://emcawiki.net/The_EMCA_wiki_Admins – I like the fact that we have all done different things at different times – and some of us have been more active than others. I hope that continues. If you would really prefer not to be acknowledged for what you’ve done – or what you may do in the future – let me know.

Secondly, I am working with Lucas Seuren and a great group of ECRs from around the world on an exciting new ISCA project. This will draw on the content in the EMCA wiki and promote it to a wider audience, as well as inviting contributions beyond bibliography entries (e.g. lists of up-to-date equipment, cross-cultural ethics frameworks for data recording, shared syllabi, useful youtube videos etc.). I hope that this will contribute positively to the wiki, without increasing any administrative overhead. Of course if any of you would like to contribute to that project too, please let me know.

Thirdly, I am aware that there are lots of features of the wiki that I have long promised to implement – and I have long delayed that implementation. I’ve written many of them down here: http://emcawiki.net/User:SaulAlbert. There is also a list of ‘known issues’ that have been pointed out as problems over the years: http://emcawiki.net/Known_Current_Emcawiki_Issues – I’m going to acknowledge now that I doubt I’ll ever have time to implement any of these myself. I have fewer and fewer of the kind of uninterrupted stretches of code hacking-time that are required for software development. Instead, I’m going to try to raise funds to pay professional programmers and systems administrators to do this. I think it’s something I could find a funder to support, and I’ll work on this – with your consent – and (if you have any ideas/time/funders) your involvement and collaboration.

I hope all of that sounds OK. I’m just going to get on with it slowly, and will welcome any thoughts/feedback/initiatives/and ideas that you all have over the next decade.

All the best, and happy 2020,

The EMCAwiki reached a milestone in 2019 Read More »

Drawing Interactions

Read our (2019) OA paper based on this project: Drawing as transcription: how do graphical techniques inform interaction analysis?

The Drawing Interactions project aims to develop new graphical techniques and tools for the transcription, analysis and presentation of research into social interaction.

The Drawing Interactions Prototype App (& source code)

In conversation analytic research, Jeffersonian transcripts of talk are usually used with traced outlines or video stills, and these techniques primarily focus on presenting polished research findings for finished publications. But what about the exploratory phases of research such as initial transcription or collaborative inspection at data sessions? The drawing interactions project uses traditional artistic still life and figure drawing techniques and detailed studies of analysts’ work practices as key starting points to inform the development of graphical tools and techniques for the transcription, analysis and presentation of social interaction.

The project team includes myself, Pat HealeyToby Harris, Claude Heath, and Sophie Skach. We have created a software prototype and a workshop/training format to support the use of drawing for interaction research and the social sciences more generally. 

The idea grew out of The Fine Art of Conversation CogSci workshop which explored artistic methods for depicting interaction in classical painting and sculpture. Here is a demo video of the current prototype and a detailed project report outlining developments so far.

Publications

Project links

Thanks to

Drawing Interactions Read More »

Re/drawing interactions: an EM/CA video tools development workshop

As part of the Drawing Interactions project (see report), Pat HealeyToby Harris, Claude Heath, and Sophie Skach and I ran a workshop at New Developments in Ethnomethodology in London (March 2018) to teach interaction analysts how and why to draw.

Sophie Skach leading the life drawing workshop at New Directions in Ethnomethodology
Sophie Skach leading the workshop at New Directions in Ethnomethodology

Here’s the workshop abstract:

Ethnomethodological and conversation analytic (EM/CA) studies often use video software for transcription, analysis and presentation, but no such tools are designed specifically for EM/CA. There are, however, many software tools commonly used to support EM/CA research processes (Hepburn & Bolden, 2016 pp. 152-169; Heath, Hindmarsh & Luff 2010 pp. 109-132), all of which adopt one of two major paradigms. On the one hand, horizontal scrolling timeline partition-editors such as ELAN (2017) facilitate the annotation of multiple ‘tiers’ of simultaneous activities. On the other hand, vertical ‘lists of turns’ editors such as CLAN (Macwhinney, 1992) facilitate a digital, media-synced version of Jefferson’s representations of turn-by-turn talk. However, these tools and paradigms were primarily designed to support forms of coding and computational analysis in interaction research that have been anathema to EM/CA approaches (Schegloff 1993). Their assumptions about how video recordings are processed, analyzed and rendered as data may have significant but unexamined consequences for EM/CA research. This 2.5 hour workshop will reflect on the praxeology of video analysis by running a series of activities that involve sharing and discussing diverse EM/CA methods of working with video. Attendees are invited to bring a video they have worked up from ‘raw data’ to publication, which we will re-analyze live using methods drawn from traditions of life drawing and still life. A small development team will build a series of paper and software prototypes over the course of the workshop week, aiming to put participants’ ideas and suggestions into practice. Overall, the workshop aims to inform the ongoing development of software tools designed reflexively to explore, support, and question the ways we use video and software tools in EM/CA research.

References

ELAN (Version 5.0.0-beta) [Computer software]. (2017, April 18). Nijmegen: Max Planck Institute for Psycholinguistics. Retrieved from https://tla.mpi.nl/tools/tla-tools/elan/

Heath, C., Hindmarsh, J., & Luff, P. (2010). Video in qualitative research: analysing social interaction in everyday life. London: Sage Publications.

Hepburn, A., & Bolden, G. B. (2017). Transcribing for social research. London: Sage.

MacWhinney, B. (1992). The CHILDES project: Tools for analyzing talk. Child Language Teaching and Therapy, (2000).

Schegloff, E. A. (1993). Reflections on Quantification in the Study of Conversation. Research on Language & Social Interaction, 26(1), 99–128.

Re/drawing interactions: an EM/CA video tools development workshop Read More »

How to use CLAN and ELAN together for EM/CA transcription

I’ve been teaching EM/CA at Berklee School of Music which has been a delight, and the students are often transcribing situations that involve music, dance, performance, composition and other settings where it’s equally important to transcribe talk and bodily action. What I’ve tried to show them is how to do transcripts that allow them to shift between turn-by-turn action and simultaneous, multi-activity interactions. Lorenza Mondada’s presentation on the differences between types of transcription software has a great explanation of the two basic transcription paradigms (partition-based, horizontally scrolling editors and turn-by-turn, vertically scrolling editors) and what they are most useful for.

I wanted to teach my students to use both paradigms and to be able to switch between them so I made this little how-to video. To follow along with this tutorial you’ll need two files: a small clip from “Game Night”(many thanks to Prof. Cecelia Ford for letting me use her often-cited CA data for this tutorial), and Game_Night.cha – the accompanying CLAN transcription file. They’re both zipped up together in this downloadable folder. You only get a tiny clip of the whole Game_Night.mov video file here. The idea of this tutorial is that you can use this as a starting point and then replace the video with your own data.

Here’s the youtube video. It was recorded for my Berklee students, so not all parts of it (especially where I refer to the data you’ll have available to you) are relevant to this blog tutorial.

How to use CLAN and ELAN together for EM/CA transcription Read More »

Assessments in the production of routine (rhythmical) closings

Here these are the references for my talk on terminal assessments and performance evaluations in a partner dance workshop at LANSI 2017

I’ve given up trying to fit them all onto one slide at the end – so here they are on this web page. A recording of the talk is to follow – here’s one of the slides for now:

A slide from the talk showing some of the normative dimensions of accountability that emerge through students' terminal performance evaluations and how they're involved in teachers' routine, terminal assessments.
A slide showing some of the normative dimensions of accountability that emerge through students’ terminal performance evaluations and how they’re involved in teachers’ routine, terminal assessments.

References

  • Albert, S. (2015). Rhythmical coordination of performers and audience in partner dance. Delineating improvised and choreographed interaction. Etnografia E Ricerca Qualitativa, 3, 399–428. https://doi.org/10.3240/81723
  • Antaki, C. (2002). “Lovely”: Turn-initial high-grade assessments in telephone closings. Discourse Studies, 4(1), 5–23. https://doi.org/10.1177/14614456020040010101
  • Antaki, C. (2000). “Brilliant. Next Question…”: High-Grade Assessment Sequences in the Completion of Interactional Units. Research on Language & Social Interaction, 33(3), 37–41. https://doi.org/10.1207/S15327973RLSI3303_1
  • Broth, M., & Mondada, L. (2013). Walking away: The embodied achievement of activity closings in mobile interaction. Journal of Pragmatics, 47(1), 41–58. https://doi.org/10.1016/j.pragma.2012.11.016
  • Broth, M., & Keevallik, L. (2014). Getting Ready to Move as a Couple: Accomplishing Mobile Formations in a Dance Class. Space and Culture, 17(2), 107–121. https://doi.org/10.1177/1206331213508483
  • De Stefani, E., & Mondada, L. (2013). Reorganizing Mobile Formations: When “Guided” Participants Initiate Reorientations in Guided Tours. Space and Culture, 17(2), 157–175. https://doi.org/10.1177/1206331213508504
  • De Stefani, E., & Gazin, A.-D. (2014). Instructional sequences in driving lessons: Mobile participants and the temporal and sequential organization of actions. Journal of Pragmatics, 65, 63–79. https://doi.org/10.1016/j.pragma.2013.08.020
  • Garfinkel, H. (1967). Studies in ethnomethodology. America. Englewood Cliffs, New Jersey: Prentice-Halll.
  • Goodwin, C., & Goodwin, M. H. (1992). Assessments and the construction of context. In C. Goodwin & A. Duranti, C. Goodwin & A. Duranti (Eds.), Rethinking context: Language as an Interactive Phenomenon (Vol. 11, pp. 147–189). Cambridge: Cambridge University Pressess.
  • Harness Goodwin, M., & Goodwin, C. (1986). Gesture and coparticipation in the activity of searching for a word. Semiotica, 62(1–2), 51–75.
  • Keevallik, L. (2010). Bodily Quoting in Dance Correction. Research on Language & Social Interaction, 43(4), 401–426. https://doi.org/10.1080/08351813.2010.518065
  • Keevallik, L. (2013). Here in time and space: Decomposing movement in dance instruction. In P. Haddington, L. Mondada, & M. Nevile, P. Haddington, L. Mondada, & M. Nevile (Eds.), Interaction and Mobility: Language and the Body in Motion (pp. 345–370). Berlin/Boston: Walter de Gruyter.
  • Oshima, S., & Streeck, J. (2015). Coordinating talk and practical action: The case of hair salon service assessments. Pragmatics and Society, 6(4), 538–564. https://doi.org/10.1075/ps.6.4.04osh
  • Pomerantz, A. (1984). Agreeing and disagreeing with assessments: Some features of preferred/dispreferred turn shapes. In J. M. Atkinson & J. Heritage, J. M. Atkinson & J. Heritage (Eds.), Structures of social action: Studies in conversation analysis (pp. 57–102). Cambridge: Cambridge University Press.
  • Schütz, A. (1951). Making music together: A study in social relationship. Social Research, 18(1), 76–97.
  • Stivers, T., & Rossano, F. (2010). Mobilizing Response. Research on Language & Social Interaction, 43(1), 3–31. https://doi.org/10.1080/08351810903471258
  • Thompson, S. A., Fox, B. A., & Couper-Kuhlen, E. (2015). Grammar in Everyday Talk: Building Responsive Actions. Cambridge: Cambridge University Press,.
  • Wiggins, S., & Potter, J. (2003). Attitudes and evaluative practices: Category vs. item and subjective vs. objective constructions in everyday food assessments. British Journal of Social Psychology, 42(4), 513–531. https://doi.org/10.1348/014466603322595257
  • Weeks, P. (1996). Synchrony lost, synchrony regained: The achievement of musical co-ordination. Human Studies, 19(2), 199–228. https://doi.org/10.1007/BF00131494
  • Wittgenstein, L. (1967). Lectures and conversations on Aesthetics, Psychology and Religious Belief. (C. Barrett, C. Barrett, Ed.). Berkeley and Los Angeles: University of California Press.

Assessments in the production of routine (rhythmical) closings Read More »

ICCA 2014 and the Future(ology) of CA

Still from Ari Folman’s “The Congress.”
Still from Ari Folman’s film “The Congress.”

Summary:

  • A brief account of my experience of ICCA 2014 (the 4th International Conference on Conversation Analysis).
  • Tips gleaned about how to present interactional data analysis in 20 minues.
  • What I learned about terminology in the analysis and presentation of CA research.
  • A little reflection on what ICCA 2014 meant for the origins and future of CA.

Introduction

In The Futurological Congress (1971) by Polish science fiction author Stanislaw Lem the protagonist attends a meeting of 70,000 researchers in the increasingly popular discipline of Futurology. There are so many Futurologists these days that they can’t possibly all give their papers in full, so they are assigned index numbers, then when it’s their turn to present they stand up and say the number. Of course there also isn’t time for questions, so all questions have to be submitted in advance and delivered by the questioners standing up and saying the number. Then the speaker may respond with the index number of their response and so on.

ICCA 2014 at UCLA was not quite at this stage yet, but it was still an awesome experience to see 500 Conversation Analysts and Ethnomethodologists from around the world gathered to present papers to one another in one of nine concurrent sessions, each paper containing a series of line-numbered transcripts of spates of interaction each of which – in themselves – could have been the subject of an entire day’s workshop.

Having watched something like 50 presentations in 4 days, with a vast range of styles and approaches, the purpose of this post is to collate tips and ideas for presentation of this kind of research, as well as provide those who weren’t able to be there with a brief impression of what ICCA 2014 was like to attend.

Overall Impressions of ICCA 2014

Conference opening speech by John heritage
Conference opening speech by John Heritage

Firstly, a brief impression, which I hope will dispel any negative implication in my referencing Lem’s sci-fi satire in the introduction. This was an extraordinarily well organised and enjoyable event. The venue, the programme, the facilities, and all the important basics were so well organised, they appeared seamless. Sessions progressed on time and with a cooperative and collegial atmosphere that everyone – especially the heroic session chairs, graduate helpers and local organisers – worked so hard to maintain. Despite its size and the diversity of approaches to the study of human interaction, my overall sense was that this conference served an unusually cohesive research community with a strong set of methodological and philosophical alignments. This became most evident to me when I realized – after fretting over having to hop between the 9 concurrent sessions to catch everything I wanted to see – that I could just as well stay put in one session, or walk into almost any other one and still find something interesting and comprehensible to me going on in every room. This is a real contrast with other conferences I’ve attended, especially in a Computer Science context where the widespread intra-field specialization means that walking into the wrong session might result in having to sit and listen to an hour of highly technical niche gibberish.

The panels I enjoyed most used this double aspect of EM/CA’s ethnographic subject-diversity and its methodological coherence to great effect. For example Arnulf Depperman’s excellent sessions on ‘Disjunct and convergent temporalities and the coordination of action’ brought together Jürgen Streeck’s work on the postural configurations of car mechanics at work, Dirk vom Lehn’s work on gallery and museum visiting, as well as Depperman’s own research into driving instruction, and Sae Oshima’s analysis of the interactional dynamics of stylists and clients as they come to the evaluation-relevant endpoint of a haircut. This was one of the most powerful examples to me of how very different interactional contexts and activities, looked at together with different analytic foci, can cohere by allowing a sense of the stable underlying structure of natural human interaction and conversation to emerge from the mix.

Two approaches to presenting (and doing) interaction analysis

Having mentioned ‘methodological coherence’, I should also point out that there were very different approaches and methods too, and they were also presented quite differently. The most obvious differences in overall approach were somewhat similar to the different dimensions of distinction in CA drawn by Emmanuel Schegloff (1996) in his paper on person reference between single case and interaction-oriented analyses on one hand, and aggregate and system-oriented analyses on the other. While these distinctions were not always entirely clear in the 20 minutes most people had to present, it became clear to me that the best presentations were the ones that chose a style to match this aspect of their analytic approach.

Here are some tips based on the best of each type of presentation that I saw. Some are common knowledge or are gleaned along with my reading of the King’s group’s excellent book on video analysis (Heath, Hindmarsh & Luff 2010).

Tips for presenting single case / interaction-oriented analyses

  1. Get to the data almost immediately, show first then tell.
  2. Make the context descriptions as integrated into the presentation as possible, and always illustrated with visible examples.
  3. Make time to show the same clip as many times as possible at multiple speeds.
  4. Don’t sit still – physically demonstrate and illustrate the embodied actions that are being talked about.
  5. Show clips with and without audio, but make sure to use the volume control when speaking over the video otherwise its impossible to hear.
  6. Avoid using transcripts, or if necessary use subtitles to avoid splitting audience focus between page and screen.
  7. If there are transcripts/cartoons/diagrams, show those first, then the video so the audience knows what to look for and gets the satisfaction of seeing it.

Jon Hindmarsh’s presentation was an excellent example of this approach. He showed the same clips on silent repeat while he walked around talking and gesticulating about them animatedly. He also returned to the same clips at the beginning and end of his session, giving us the opportunity to see our perception of the action in the clips changing as we heard his analysis. The final time we saw it at the end was quite powerful for this reason.

Tips for presenting aggregate / system-oriented analyses

  1. Make clips and transcripts as short and concise as possible, just focus on the phenomenon in question.
  2. If there is important stuff earlier or later on in the interaction, show it on screen using subtitles/animation.
  3. Make introductions pithy and descriptive, but don’t spend too long on them. If relationships etc. are important, do a diagram.
  4. When showing an interactional effect, show it not happening too. Standard practices should be demonstrated alongside deviant cases.
  5. When going through the analysis, only talk about details relevant to the phenomenon. A presentation is not the place for a comprehensive analysis, and it’s distracting from the main point.
  6. Be extra careful not to run out of time. Almost all the presentations ran out of time, and whereas I could still get a lot from a badly timed interaction-oriented analysis, it was really hard to make sense of aggregate analyses that never completed their narrative arc.
  7. Don’t show video if the analysis does not depend on it.

Alexa Hepburn and Paul Drew’s paper on absent apologies was a great example of an aggregate analysis of a phenomenon that – by virtue of its absence – required both deviant and non-deviant cases to be presented in a kind of drip-drip of evidence, building up to an aggregate view of the phenomenon. Along the way there were lots of mini-system insights into how the mechanisms of accounting and accountability for apologies work in different ways, and although they did run out of time a bit, they were able to skip several of the deviant cases to complete the overall picture and reach the phenomenon in question. They also had excellent transcripts which included the ethnographic glosses so you could also reconstruct the missing pieces of the puzzle from the data after the fact.

The most important thing I learned at ICCA 2014

In Lem’s novel, the academic discipline of futurology is based on a practical extrapolation of Sapir-Whorfian notions of language being a necessary prerequisite for rendering the world intelligible through thought. The practice of futurology involves future-casting by a kind of reverse-etymology. Futurologists come up with new words and phrases and evaluate them for their potential meaningfulness. The idea is that if your phrase is semantically loaded and suggestive of other, related terminologies, it may at some point come to mean something. The implications of those potential meanings are then the concern of futurologists.

Alongside a fantastic series of pre-conference workshops, graduate students were invited to sign up to have lunch with a group of CA grandees. I was thrilled to get (literally) a ticket to talk with Anita Pomerantz – whose work was the starting point for my entire PhD thesis. It was great to meet and thank her in person for that, and very interesting to hear what she had to say when I insisted she give us some sage advice (her own very gracious approach was to focus on us and our research interests). Notably, she said “don’t use the term preference”, and went on to advise against using terms like “adjacency pair” and all the other bits of terminology established analytically by her first generation of CA people.

This intrigued me, as she is often credited with initiating a whole rich seam of work on preference and dispreference with her work on compliment responses (1978) and second assessments (1984). She explained that she was telling us to avoid using these words as shortcuts to, or even replacements for a proper analysis. I have heard similar things from others in her generation, for whom using these terms must feel very different given that they had to do the analytic work first to clarify and then invent them.

As the conference proceeded, I got a very tangible sense of why this advice is so important. Very often I saw people presenting great research, but peppering their presentations with these kinds of keywords, usually needlessly. These terms are useful, especially for structuring training and disciplined analysis, and for spreading knowledge about CA and its inner workings. It’s hard to imagine a CA textbook not including a full description of adjacency pairs or preference organization. However, their use in this context mostly seemed aimed at expressing group membership rather than contributing to the analysis at hand.

So, given that this was my first CA conference, the key thing I learned at ICCA 2014 was that it’s only worth naming these analytic terms in presentations of research findings where they are absolutely salient to the analysis and phenomena at hand. The transcripts and the data are presented so that other researchers who are familiar with CA methods can challenge the conclusions drawn from them. All the CA terminology is a vital but essentially back-room business that doesn’t need to feature in the presentation of findings at all.

The Future(ology) of CA

Given the breadth and diversity of the research presented at ICCA 2014, it’s difficult to sum it up in anything other than a very partial and subjective way. Having said that, there were a few moments and aspects of the event that suggested some interesting potential directions of contemporary CA.

Firstly, there was a set of presentations in the ‘Hybrids Heretics and Converts’ category that had its own panel on the Friday. Unfortunately I missed most of this, but had the chance to speak to some of the presenters and their colleagues – many from the Max Planck Institute for Psycholinguistics in Nijmegen, and most supervised by Stephen Levinson. The presentations I did see had a distinctive style and structure, familiar to me from hypothetico-deductive models of presentation that I see in my home disciplines of Computer Science and Engineering. I was pleased to see Schegloff in these panels, respectfully engaged with (mostly) young researchers, offering constructive critique. One of his criticisms of much of the experimental work presented was that it tended to focus on moments of experimentally-salient (but interactionally isolated) conversational structure. His argument was that talk is densely layered and interconnected, and that by isolating temporal fragments of talk from continuous processes of interaction, all that contextual interconnection is lost. It was great that there was space for debate focussed on these issues that extend from long-running questions of quantification in the study of human interaction, which is especially healthy given the quantitative (though not yet widespread experimental) turn in recent prominent CA work.

Photo of Harvey Sacks from the exhibition 'Order At All Points'
Photo of Harvey Sacks from the exhibition ‘Order at all points: the work of Harvey Sacks’

Secondly, the ISCA general meeting was interesting for me, as a neophyte, to find out more about CA as an organisational project, and get a feel for its origins and future. It was lovely to see Schegloff being awarded an honour for lifetime achievement, and the speeches and presentations were moving, especially given that this is the 40 year anniversary of what is often seen as the founding of the discipline with Sacks Schegloff and Jefferson’s 1974 turn-taking paper. There was also a fantastic exhibition entitled “Order at All Points: The Work of Harvey Sacks” in the Young library featuring key papers, letters, photos and artifacts from the Sacks archive. Alongside these celebrations, ISCA chair John Heritage set out that the focus of the next four years would be on developing and disseminating more educational resources in CA – and he announced that Schegloff was very generously donating all his transcripts, course notes, assignments and recordings to ISCA for publication. While many people whooped and cheered at this bit, Schegloff turned around in his seat at the front and hooted “Yo:::u’ll be S^OrE:::e,” at the crowd.

Video still from the exhibition 'Order at all points: the work of Harvey Sacks'
Video still from the exhibition ‘Order at all points: the work of Harvey Sacks’

Finally, the ICCA baton was passed from ICCA 2014 lead organiser Tanya Stivers to conference chair Paul Drew at Loughborough where the 2017 conference will take place, with Lorenza Mondada also announcing that there would be an interim ISCA-sponsored conference in Basel in 2015 entitled ‘Revisiting Participation’. Given how much I enjoyed and got out of ICCA 2014, I’m very much looking forward to those.

References

  • Heath, C., Hindmarsh, J., & Luff, P. (2010). Video in qualitative research: analysing social interaction in everyday life. Sage Publications.
  • Lem, S. (1985). The Futurological Congress (from the Memoirs of Ijon Tichy). Harcourt Brace Jovanovich.
  • Schegloff, E. A. (1996). Some Practices for Referring to Persons in Talk-in-Interaction: A Partial Sketch of a Systematics. In B. Fox (Ed.), Studies in Anaphora (pp. 437–85). Amsterdam: John Benjamins Publishing Company.
  • Pomerantz, A. (1978). Compliment responses: Notes on the co-operation of multiple constraints. In J. Schenkein (Ed.), Studies in the organization of conversational interaction. Academic Press.
  • Pomerantz, A. (1984). Agreeing and disagreeing with assessments : some features of preferred / dispreferred turn shapes. In J. M. Atkinson (Ed.), Structures of social action: Studies in Conversation Analysis (pp. 57–101). London: Cambridge University Press.

ICCA 2014 and the Future(ology) of CA Read More »

The Data Session

The ‘data session’ has become my favourite research activity since starting to work with ethnomethodology (EM) and conversation analysis (CA). However, this crucial bit of analytic trade-craft seems poorly documented as a research process – with minimal references scattered throughout textbooks, articles and course materials. This post pulls together some of the descriptions and tips I’ve found relating to the practical activity of doing data sessions, followed by a short account of why I am so fond of this wonderful research practice.

Early CA work

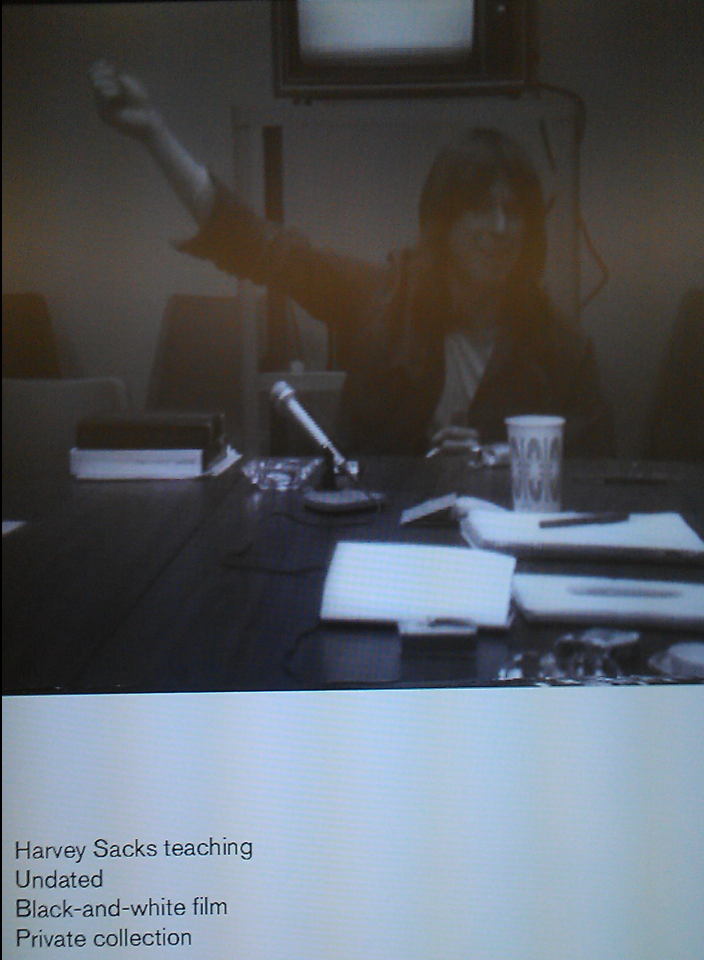
I can’t find any direct references to data session practices in any of the early CA literature from Sacks, Schegloff or Jefferson. However, there are some very interesting methodological discussions that provide insight into how data is prepared and collected prior to a principled collection being established in the following two papers:

I can only assume that the trade craft of CA was being established at this time, so the practice of the data session was not yet at a point where it was stable, well understood and ready to be written up for instructional purposes. I’ve heard stories (but can’t find any write-ups) of how Gail Jefferson was particularly involved in its development as a pedagogical/analytic practice. I would be very interested in reading these stories – and particularly learning about any rules / procedures for doing data sessions that may have been established in these early days.

First instructional descriptions

Paul ten Have’s “Doing Conversation Analysis” first published in 1999 provides one of the first instructional descriptions of the data session I can find – and lays out the essentials of what the data session consists of very clearly:

“The data session can be seen both as a kind of playground to mutually inspire one’s understanding of the data, and as an environment that requires a rather specific ‘discipline’. A ‘data session’ is an informal get-together of researchers in order to discuss some ‘data’ – recordings and transcripts. The group may consist of a more or less permanent coalition of people working together on a project or in related projects, or an ad hoc meeting of independent researchers. The basic procedure is that one member brings in the data, for the session as a whole or for a substantial part of it.”

He then provides – as far as I can find – the first description of the actual practical activity in the data session, and how it functions as a pedagogical as well as an analytic practice:

“This often involves playing (a part of) a tape recording and distributing a transcript, or sometimes only giving a transcript. The session starts with a period of seeing/hearing and/or reading the data, sometimes preceded by the provision of some background information by the ‘owner’ of the data. Then the participants are invited to proffer some observations on the data, to select an episode which they find ‘interesting’ for whatever reason, and formulate their understanding, or puzzlement, regarding that episode. Then anyone can come in to react to these remarks, offering alternative, raising doubts, or whatever. What is most important in these discussions is that the participants are, on the one hand, free to bring in anything they like, but, on the other hand, required to ground their observations in the data at hand, although they may also support them with reference to their own data-based findings or those published in the literature. One often gets, then, a kind of mixture, or coming together, of substantial observations, methodological discussions, and also theoretical points. Data sessions are an excellent setting for learning the craft of CA, as when novices, after having mastered some of the basic methodological and theoretical ideas, can participate in data sessions with more experienced CA researchers. I would probably never have become a CA practitioner if I had not had the opportunity to participate in data sessions with Manny Schegloff and Gail Jefferson.”

Have, P. Ten. (2007). Doing conversation analysis: A Practical Guide (2nd ed.). London: Sage Publications. pp. 140-141.

He also mentions that these sessions are poorly documented, writing (in the 1999 and 2007 editions of his book) that he can only find one real description in Jordan & Henderson (1995) quoted below. They also note that the data session – which they call the “Interaction Analysis Laboratory” is both vitally important, and difficult to describe in formal/procedural terms:

“Group work is also essential for incorporating novices because Interaction Analysis is difficult to describe and is best learned by doing. Much in the manner of apprentices, newcomers are gradually socialized into an ongoing community of practice in which they increasingly participate in the work of analysis, theorizing, and constructing appropriate representations of the activities studied.”

They also provide a great description of the actual mechanics of presenting data, and how specific heuristics in the organisation of the data session can mitigate against rambling, ungrounded theoretical speculation:

The tape is played with one person, usually the owner, at the controls. It is stopped whenever a participant finds something worthy of remark. Group members propose observations and hypotheses about the activity on the tape, searching for specific distinguishing practices within a particular domain or for identifiable regularities in the interactions observed. Proposed hypotheses must be of the kind for which the tape in question (or some related tape) could provide confirming or disconfirming evidence. The idea is to ground assertions about what is happening on the tape in the materials at hand. To escape the ever-present temptation to engage in ungrounded speculation, some groups have imposed a rule that a tape cannot be stopped for more than 5 min. This means in practice that rambling group discussions are discouraged and that no single participant can speculate for very long without being called upon to ground her or his argument in the empirical evidence, that is to say, in renewed recourse to the tape.

Jordan, B., & Henderson, A. (1995). Interaction analysis: Foundations and practice. The Journal of the Learning Sciences, 4(1), 39–103.

Recent accounts and empirical work

More recent instructional publications have included tips on data sessions. For example, in Heath, Hindmarsh & Luff (2010), there is one tip section, and one appendix on data sessions. They introduce the basic idea, and also mention its pedagogic function, as well as highlighting the opportunity for its use in interdisciplinary / workplace studies that involve practitioners from other fields:

“[Data sessions] can also be used to introduce new members of a team or research group into a particular project and can be very important for training students in video based analysis. On occasions it can also be helpful to have ‘practitioners’, personnel from the research domain, participate in data sessions, as they can provide distinctive insights, and can often help to clarify events that have proved difficult to understand. in data sessions it is important to avoid overwhelming participants with too much material. A small number of brief extracts of, say, no more than 20 seconds or so is fine. it is also helpful to provide transcripts of the talk as well as any other materials that may be useful for understanding the extracts in question.”

They also add a number of key points about the distinct benefits and caveats of running data sessions, paraphrased here:

  • identifying candidate phenomena for more detailed study.
  • Enforcing evidential demonstration of analytic claims.
  • Revealing issues/challenges in demonstrating analytic findings.
  • Eliciting alternative/complimentary perspectives.
  • Generating new analytic ideas/issues and suggesting improvements for future data collection.
  • Keeping one’s ‘hand in’, i.e. practising analysis on other people’s data to maintain a fresh eye/ear for your own research.

Then they say something explicit about the data session as a collaborative practice which I haven’t seen anyone else mention, but it seems absolutely crucial to me. The fact that this almost never comes up also reinforces my sense that EM/CA and its research practices in general are much less fraught by this particular problem than many other research contexts, which speaks extremely well for it as a community and its empirical/epistemic commitments in general:

“Data sessions are a collegial activity and are based on mutual trust. They should be treated as such and discussions of intellectual Property and the like should be avoided. It is up to individual participants to reveal or withhold ideas that they have, if they do or do not want others use those ideas in future analytic work.”

The appendix with more tips on data sessions (pp.156-157) has more very useful practical advice. To paraphrase:

  • Limit the numbers to no more than 20 or so.
  • Presenters should select 3-6 clips, ideally under 30s each.
  • Do bring transcripts – even rough ones are helpful.
  • Bring any supplementary material that is relevant/necessary for understanding the action.
  • Look at one fragment of data at a time – approximate ratio of 20-30m on each 5s of recording.
  • Don’t cheat and look ahead, or rely on analyst’s information exogenous to the clip itself.
  • When it’s done, sum up, take notes and get general reflections.

Heath, C., Hindmarsh, J., & Luff, P. (2010). Video in qualitative research: analysing social interaction in everyday life. Sage Publications. pp. 102-103.

There is a wonderfully reflexive EM/CA analysis of a data session in a chapter by Harris, Theobold, Danby, Reynolds & Rintel (2012) in a volume on postgraduate pedagogical practices that presents the analysis of a data session by the authors and data session participants themselves. They focus on the collaborative / peer pedagogical aspects of the session, and highlight the “fluidity of ownership of ‘noticing'” with reference to clear evidence of how these noticings can be done in this way.

Harris, J., Theobald, M. A., Danby, S. J., Reynolds, E., & Rintel, S. (2012). “What’s going on here?” The pedagogy of a data analysis session. In A. Lee & S. J. Danby (Eds.), Reshaping doctoral education: International Approaches and Pedagogies (pp. 83–96). London: Routledge.

A participant-observer account

Finally, my favourite description of work practices in the data session was written by John Hindmarsh in the affectionate and humorous Festschrift publication he and his colleagues edited for Christian Heath. In an uncharacteristically participant-observer style, he nonetheless describes the detail of both pedagogical and analytic processes of “Heath’s natural habitat: The data session” very vividly. He includes:

  • Delicate interrogations: where researchers are subtly probed as to why they selected specific clips.
  • Occasioned exclamations: in which the seasoned analyst will hoot with infectious laughter or joy at a clip – infectious partly because it can leave less experienced researchers either shamefully nonplussed or scrambling to find a grounding for the source of the laughter.
  • Transcription timings: opportunities to (delicately) rectify transcription errors.
  • Re-characterisations: moments where a banal, if well-targeted observation is picked up and re-packaged as an elegant and insightful analysis – a form of agreement with some extra pedagogical/analytic impetus.
  • Troubled re-characterisations: same as above, but done as an (initially veiled) disagreement, demonstrating poor targeting or a flawed analysis – again, always analytically useful and instructive, but less pleasantly so.

Hindmarsh, J. (2012). Heath’s natural habitat: The data session. In P. Luff, J. Hindmarsh, D. vom Lehn, & B. Schnettler (Eds.), Work, Interaction and Technology: A Festschrift for Christian Heath. (pp. 21–23). London: Dept. of Management, Kings College London.

Finally – some of my own reflections on the data session – and why it constitutes such an important methodological and pedagogical practice.

Why I love data sessions and why you should too

The last description of the trade craft of a particular researcher’s data session is my favourite because it shows what an excellent apprenticeship situation this is. Whereas instruction in environments where empirical data is less straight-forwardly ready-at-hand, there is a latency between the teaching moment and the understanding moment that is frustratingly difficult to bridge. In this situation, the data is really doing the teaching, but the skilled analyst elicits both the observation and its pedagogical thrust from the same few seconds of interaction that has been in plain sight all along.

Furthermore, this public availability of the data as a mutually assessable resource to the group provides a constant check on authoritative hubris. More than once I’ve seen a junior analyst grasping and holding onto a powerful observation that provides irrefutable counter-evidence to a more experienced analyst’s position on some piece of data. There is honesty and accountability that flows in each direction in the data session, which is what makes it such a wonderful occasion for learning, analysis and – literally – serious fun.

I also like Jon Hindmarsh’s description because it really captures what it’s like to attend data sessions with different people who love the practice. I’m new to it, but thanks to the generosity of my supervisor Pat Healey and his enthusiasm for this work I’ve had the great pleasure of analysing data with pros such as Steven Clayman, Chuck Goodwin, Christian Heath, John Heritage, Yuri Hosoda, Shimako Iwasaki, Celia Kitzinger, Dirk vom Lehn, Gene Lerner, Rose McCabe, Tanya Stivers, Liz Stokoe and Sandy Thompson, not to mention my fellow students in these sessions from whom – given the peer pedagogical structure of the data session – I was able to learn just as much.

My experience has been that everyone approaches data very differently, and each person has a very distinctive style, analytic focus and approach. Nonetheless, the dynamics and epistemic arrangements of the situation allows for an amazingly rich exchange of ideas and empirical observations between disciplines, across interactional contexts, cultures, languages and focal phenomena. I am convinced that it is one of the most crucial factors in how EM/CA projects have made such robust findings in studies of interaction, language and culture, and that there is a great deal more to be understood and appreciated about how they function.

I am also convinced that the data session has a very important place in disseminating EM/CA findings and practices beyond studies that centre onits traditional sociological/anthropological/linguistic contexts of study. There are sure to be ways of adapting some of its pedagogical/analytical dynamism to working with other contexts and types of recorded materials – although it’s debatable whether this form of analysis would really work with anything other than interactional data. In any case, as I mentioned at the beginning – I am very curious about other data session practices and would like to know more about the similarities and differences in how people run theirs, so, I would be very grateful if you would send me your data session experiences/tips/formats and training materials.

The Data Session Read More »

How to prepare for an EM/CA data session

Participants in the first EMCA DN Meting

At the inaugural EMCA Doctoral Network meeting (my write-up here), where there were a mix of researchers with different levels of familiarity with EM/CA, I realised that the process of preparing for a data session – one of the most productive and essential tools of interaction analysis – is really poorly documented. There are some guidelines provided in textbooks and on websites that usually include issues of how to do the analysis/transcription itself, but nowhere is there a simple guide for how to actually get ready to contribute your data to a data session. This short primer is intended to fulfil that function, and invite others to contribute their own tips and best practices. 

I was more or less in this situation (having crammed my head full of CA literature without having had a great deal of hands-on data session practice) last year when I went to the Centre for Language Interaction and Culture at UCLA. There I had the chance to witness and participate in four separate weekly data sessions run by Steven Clayman, Chuck Goodwin, John Heritage, Gene Lerner, Tanya Stivers and Sandy Thompson and their students. It was a bit of a baptism of fire, but I learned a lot from it.

Each of the pros had interestingly different approaches to preparing data for the sessions, all useful in slightly different ways so I decided to write up my synthesis of best practice for preparing your data for a data session. Feedback and comments are very welcome!

What/who this guide is for:

This guide is intended for researchers interested in participating in data sessions in the tradition of Ethnomethodology and Conversation Analysis (EM/CA), who already have data and want to figure out how to present it.

This is not about gathering data, specific analytic approaches or about actually doing detailed analysis or any of the meat and potatoes of EM/CA work which is amply covered in many books and articles including:

This guide is intended to help researchers who may not have had much experience of data sessions to prepare their data in such a way that the session will be fun and analytically useful for them and everyone else who attends.

This is also not intended to be a primer in the use of specific bits of audio/video/text editing or transcription software – there are so many out there, I will recommend some that are freely available but pretty much any will do. I do plan to do this kind of guide, but that’s not what this article is for.

Selecting from your data for the session

Doing a data session obviously requires that some kind of data selection has to be made, so it helps to have a focal phenomenon of some sort. Since the data session is exploratory rather than about findings, it doesn’t really matter what the phenomenon is.

That’s the great thing about naturally occurring data – you might not find what you’re looking for, but you will find something analytically interesting. Negative findings about your focal phenomenon are also useful – i.e. you might find out that you’ve selected your clips with some assumptions about how they are related – you might find that this is not borne out by the interaction analysis. That is still a useful finding and will make for a fun and interesting data session.

Example phenomena for a rough data-session-like collection of extracts might focus on any one or on a combination of lexical, gestural, sequential, pragmatic, contextual, topical etc. features. E.g.:

  • Different sequential or pragmatic uses of specific objects such as ‘Oh’, ‘wow’ or ‘maybe’.
  • Body orientation shifts or specific patterns of these shifts during face-to-face interaction.
  • Word repeats by speaker and/or recipient at different sequential locations in talk.
  • Extracts from interactions in a particular physical location or within a specific institutional context.
  • Extracts of talk-in-interaction where speakers topicalize something specific (e.g.: doctors/teapots/religion/traffic).

At this stage your data doesn’t have to be organised into a principled ‘collection’ as such. Having cases that are ostensibly the same or similar, and then finding out how they are different is a tried and tested way of finding out what phenomenon you are actually dealing with in EM/CA terms.

There are wonderful accounts of this data-selection / phenomenon discovery process with notes and caveats about some of the practical and theoretical consequences of data selection in these two papers:

Pre-data session selection: how to focus your selection on a specific phenomenon.

You can bring any natural data at all to a session and it will be useful as long as it’s prepared reasonably well. However if you want the session to focus on something relevant to your overall project, it is helpful to think about what kind of analysis will be taking place in the session in relation to your candidate phenomenon and select clips accordingly.

There are proper descriptions of how to actually do this detailed interaction analysis in the references linked above. However, here is a paraphrase of some of the simple tips on data analysis that Gene Lerner and Sandy Thompson give when introducing an interdisciplinary data session where many people are doing it for the first time in their wonderful Language and the Body course:

  1. Describe the occasion and current situation being observed (where/when/sequence/location etc.).
  2. Limit your observations to those things you can actually point to on the screen/transcript.
  3. Then, pick out for data analysis features/occasions that are demonstrably oriented to by the participant themselves.
  4. That is your ‘target’, then zoom in to line-by-line, action-by-action sequences and describe each.
  5. Select a few targets where you can specify what is being done as the sequence of action unfolds.

Then in the data session itself, you and other researchers can look at how all interactional resources (bodily movements / prosody / speech / environmental factors) etc. are involved in these processes and make observations about how these things are being done.

Providing a transcript

I find it very hard to focus on analysis without having a printed transcript but there are a few different approaches each with different advantages and disadvantages. Chuck Goodwin, for example, recommends putting Jeffersonian transcription subtitles directly onto the video/audio clips so you don’t have to split focus between screen and page. However, most researchers produce a transcript using Jeffersonian transcription and play their clips separately.

Advantages of printed transcriptions

  • You and other participants have something convenient to write notes on.
  • You can capture errors or issues in the transcription easily.
  • Participants can refer to line numbers that are off-screen when they make their observations.

Advantages of subtitles on-screen

  • You don’t miss the action looking up and down between page and screen.
  • Generally easier to understand immediately than multi-line transcript when presenting data in a language your session participants might not understand.
  • You can present this data in environments where you don’t have the opportunity to print out and distribute paper transcripts.

In either case you will need to take the time to do a Jeffersonian transcription so why not do both?

Jeffersonian transcription

There are lots of resources for learning Jeffersonian transcription, here are some especially useful ones:

Visual/graphical transcripts

Chuck and Candy Goodwin often also present carefully designed illustrations alongside their final analyses. Some people also present their data, usually at a later stage of research with detailed multi-modal transcripts incorporating drawings, animations, film-strip-like representations etc. (see Eric Laurier’s paper for a great recent overview):

  • Laurier, E. (2014). The Graphic Transcript: Poaching Comic Book Grammar for Inscribing the Visual, Spatial and Temporal Aspects of Action. Geography Compass, 8(4), 235–248.

How much work you want to do on your transcript before a data session is up to you but it is probably premature to work on illustrations etc. until you have some analytic findings to illustrate.

Transcription issues vs. errors

It’s inevitable that other people will hear things differently, so the data session is a legitimate environment for improving a transcript-in-progress. In fact, often analytic findings may hinge on how something is heard, and then how it is transcribed – this is a useful thing to discuss in a data session and will be instructive for everyone. However, it is important to capture as much as possible of the obvious stuff as accurately as possible to provide people with a basic resource for doing analysis together without getting hung up on simple transcription errors rather than the interesting transcription questions.

Introducing your data

It is useful to give people a background to your data before you present it. This does not have to be a full background to all your research and the study you are undertaking. In fact, it’s useful to omit most of this kind of information because the resource you have access to in the data session are fresh eyes and ears that aren’t yet contaminated by assumptions about what is going on.

In terms of introducing your study as a whole, it’s useful to have a mini presentation (5 mins max for a 1.5h data session) prepared about your study with two or three key points that can give people an insight into where/what you are studying. Once you’ve made one of these for each study you can re-use it in multiple data sessions.

In terms of introducing each clip, have a look at Schegloff’s (2007) descriptions of his data extracts. They have a brilliantly pithy clarity that provides just enough information to understand what is going on without giving away any spoilers or showing any bias.

Preparing your audio/video data.

Assuming you already have naturalistic audio/video data of some kind, make some short clips using your favourite piece of audio/video editing software. The shorter the better (under 30s ideally) – longer clips, especially complex/busy ones may need to be broken down for analysis into smaller chunks.

It can be time-consuming searching through longer clips for specific sections, so I recommend making clips that correspond precisely to your transcript, but noting down where in the larger video/audio file this clip is located, in case someone wants to see what happens next or previously.

Copy these clips into a separate file or folder on your computer that is specifically for this data session – finding them if they’re buried in your file system can waste time.

If possible, test the audio and video projection/display equipment in the room you’re running the data session to make sure that your clips are audible and visible without headphones and on other screens. If in doubt, use audio editing software (such as Audacity) to make sure the audio in your files is as loud as possible without clipping. You can always turn a loud sound system down – but if your data and the playback system you’re using is too quiet – you’re stuck in the data session without being able to hear anything.

There are many more useful tips about sound and lighting etc. in data collection in Heath, Hindmarsh & Luff (2010).

The mechanics of showing your data

I find it useful to think of this as a kind of presentation – just like at a conference or workshop, so I recommend using presentation software to cue up and organise your clips for display rather than struggling looking through files and folders with different names etc…

Make sure each clip/slide is clearly named and/or numbered to correspond with sections of a transcript, so that people can follow it easily, and make sure you can get the clip to play – and pause/rewind/control it – with a minimum of fuss.

The data session is probably the most useful analytic resource you have after the data itself, so make sure you use every second of it.

Feedback / comments / comparisons very welcome

I hope this blog-post-grade guide is useful for those just getting into EMCA, and while I know that data session conventions vary widely, I hope this represents a sufficiently widely applicable set of recommendations to make sense in most contexts.

In general I am very interested in different data session conventions and would very much welcome tips, advice, recommendations and descriptions of specialized data session practices from other researchers/groups.

More very useful tips (thanks!):

Dr Jo Meredith adds: “because data sessions can be a bit terrifying the temptation’s to take some data you can talk about in an intelligent way, best data sessions i’ve been to have been with new pieces of data, and I’ve got inspired by other people’s observations”

How to prepare for an EM/CA data session Read More »

Report from the first EMCA Doctoral Network meeting

Poster drawing session

I’m on my way back from the inaugural meeting of the inaugural EMCA Doctoral Network in Edinburgh this weekend, which has been one of the best PhD-related events I’ve ever had the pleasure of attending. The last word on the meeting by Anca Sterie (one of the participants) at the summing-up got it absolutely right: the openness, intellectual curiosity and thoughtful care of the organisers and the meeting as a whole was unusual and extremely encouraging.

In any case, I thought it would be useful to document how the workshop was put together, because the format and approach was well worth replicating, especially in a field like EM/CA that can only really progress if people have ways of practising and becoming skilled collaborators in data sessions.

Update: Thanks to Eric for the nice photos!

Before the workshop

The organisers sent us a full timetable before the workshop including a list of readings to have a look at. The readings were two methodology-focussed papers from Discourse Studies:

  • Lynch, M. (2000). The ethnomethodological foundations of conversation analysis. Text – Interdisciplinary Journal for the Study of Discourse, 20(4), 517–532. doi:10.1515/text.1.2000.20.4.517
  • Stokoe, E. (2012). Moving forward with membership categorization analysis: Methods for systematic analysis. Discourse Studies, 14(3), 277–303. doi:10.1177/1461445612441534

They also included other authors’ responses to both papers, highlighting methodological differences and challenges.

The sign-up sheet that the workshop organisers mailed around had asked us in advance whether we wanted to do a research presentation or use our data in a data session or both. The timetable made it clear where, when and to whom we were going to be presenting.

Tim Smith introducing the workshop

Day 1

10:00 – 11:00 Icebreaker:

After coffee and name-badging we made our way into the old library and were allocated seats in small groups of 5 or 6. It was nice to have our names on the tables like at a wedding or something – not a biggie but it made me feel welcome and individually catered-for immediately.

Tables at the EMCA DN wedding

An orientation talk from the organisers Tim Smith and Eric Laurier got us ready to go, then we did a particularly inspired ice-breaker: 20 minutes to use the flip-chart paper and coloured markers on the tables create a hand-drawn poster about our research summarising what we were doing in our PhDs and noting down things we would like help with or wanted to collaborate on. Then the posters were hung up on a long piece of string wound all the way around the room and we had the chance to mingle, grab a coffee and circulate.

Posters hanging up after the ice-breaker


The string and posters stayed up throughout and had the effect of making the library feel fun, colourful and informal.


11:00 – 12:30 Reading Session

We then went with our groups to a few different rooms for a reading session where we discussed one of the texts we’d been sent. In my group we discussed the Stokoe text and the responses we’d read. This was a very useful way to meet each other with a common text to discuss that helped us see how we all had quite different responses and were coming from different perspectives.

The choices of methodology papers and responses had been a great idea for this reason: rather than doing the obvious thing of giving us some foundational EMCA papers this choice provided participants from many disciplines with a way to get involved in issues and debates within EMCA.

13:30-15:00 Data Session 1

After lunch we got our teeth into the first data session. We broke up into different groups of 5 or 6 and those of us who had signed up to present data got a chance to get feedback and ideas from the wonderful collaborative practice of looking at natural data together.

Some participants hadn’t done data sessions before, but there were sufficient numbers of experienced analysts and in my session Liz Stokoe (the plenary speaker) for the day was on hand to facilitate.

In any case, it was fascinating to see the work that people were doing. Geraldine Bengsch had some great multi-lingual data from hotel check-in counters that really reminded me of episodes of Fawlty Towers. It showed how the humour of that situation comedy comes in part from the interactional contradictions of working in the ‘hospitality industry’. The clue’s in the name I guess: where staff somehow have to balance the imperatives of making customers feel welcome and comfortable with needing to extract full names, credit card details, passports and other formalities and securities out of them.

15:00-16:00 Walk

This was a nice moment to have time to chat informally while having a look around the city or (in my case) sheltering from the pouring rain in a nearby cafe.

16:00 – 17:00 Plenary

Liz Stokoe presenting CARM

Liz Stokoe then gave a plenary talk that was unusual in that it focussed mostly on her methods of explaining EMCA to non-academics and on the challenges of making EMCA research both public and open to commercial opportunities in communication training with CARM. This kind of talk just doesn’t get done often enough in academia in general. In many fields academics treat discussing ‘impact’ as a necessary evil reserved for review boards, grant justifications and job applications – but never even mention it as part of PhD student training. Stokoe’s talk was open and honest about the challenges and conflicts in this process and it was really useful to see how someone had learned – through repeated efforts – to explain this kind of work to people effectively in non-academic workshop environments.

Although the talk didn’t really relate to the papers we’d read in preparation for the meeting I actually thought this was a much more useful talk in the context than a purely academic presentation. Also, we still had plenty of time to ask Liz questions about her academic research afterwards and over a very nice dinner for all participants.

Day 2

After meeting up for a coffee at around 9 we split up into different groups of 6 again, this time for the presentation sessions.

0900 – 10:00: Presentation Sessions

Chandrika Cycil presenting her data

I was presenting so I only got to see one other presenter: Chandrika Cycil who had some fantastic multi-screen data from her research on car-based interactions focussing particularly on mobile uses of media technologies. There were some lovely recordings of a family occupying very differently configured but overlapping interactional environments (i.e. front-passenger seat / back-seat / driver) together. It was fascinating to see how they worked with and around these constraints in their interactions. For example, the ways the driver could use the stereo was really constrained by having to split focus with the road etc. whereas the child in the front passenger seat could exploit unmitigated access to the stereo to do all kinds of cheekiness.

I also got some really nice feedback and references from my presentation on rhythm in social interaction that I’ll be posting soon.

10:00 – 11:30: Data Session 2

I was also presenting in the final data session. This session – and the meeting as a whole – strongly reaffirmed my affection for the data session as a research practice. There’s no academic environment I’ve found to be so consistently collaborative, principled, and generous in terms of research ideas generated and shared. So – as always in data sessions – I got some amazing analytic ideas from Mengxi Pang, Yulia Lukyanova, Anna Wilson and Lorenzo Marvulli that I can’t wait to get working on.

11:30 – 12:00: Closing review

In the last session we had a chance to give feedback and start planning the next meeting – I think the date we arrived at was the 27th/28th October. If you’re a PhD student working with (or interested in working with) EMCA, and didn’t make it to this one – I strongly recommend putting the dates in your diary for the next one!

Report from the first EMCA Doctoral Network meeting Read More »